
How to Build a Marketing Measurement Strategy

Your team's Monday dashboard review takes 45 minutes. Forty-seven metrics scroll across three screens, and the story they tell changes depending on which one you look at: traffic up 12%, email open rate down 3%, LinkedIn impressions somewhere in the millions.
And when the CEO asks the only question that actually matters ("is marketing working?"), the room goes quiet while somebody pulls up a slide about Marketing Qualified Leads (MQLs) and somebody else mentions a 14% lift in branded search, and the CEO nods politely and moves on, no more informed than before the meeting started.
One company solved this so thoroughly they got their entire measurement down to a single metric that the entire organization, from the CMO to customer support, used to make every decision for two years running. How they got there, and what happened to their results, is worth the detour. But the path starts here, with why the 47-metric dashboard fails.
This is what happens when measurement substitutes for strategy. More data, more dashboards, more reports, and somehow less clarity than you had before you started tracking anything at all.
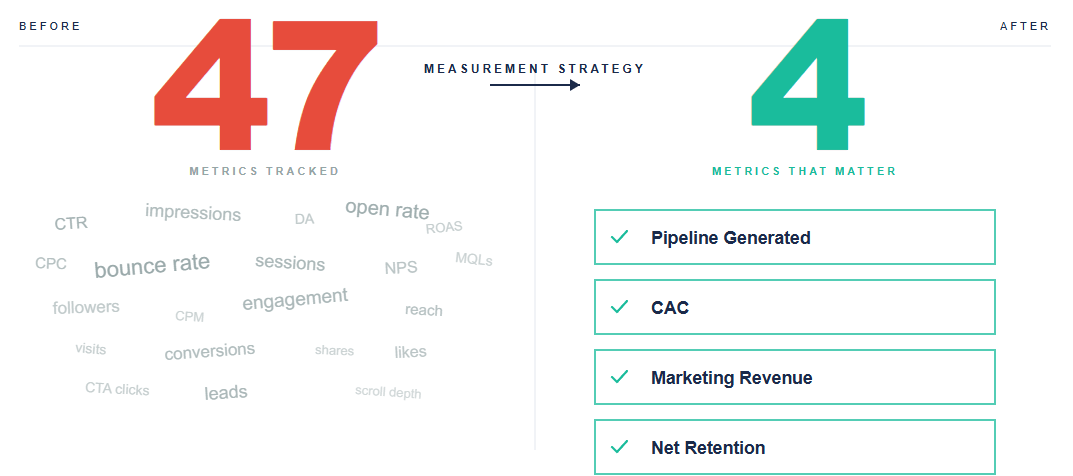
A measurement strategy isn't a dashboard or a list of 47 Key Performance Indicators (KPIs). A measurement strategy is the decision framework that tells you which 3-4 numbers you'd check if you could only check 3-4, and what specific action you'd take when each one moves. Everything else is decoration that burns attention without producing clarity.
TL;DR: A measurement strategy isn't a dashboard or a list of KPIs. It's the decision framework that identifies which 3-4 metrics matter above all others and what action you'd take when each one moves. The fix for drowning in data isn't better dashboards or more sophisticated tools; it's radical metric reduction, paired with pre-committed action thresholds that turn numbers into decisions.
The path from drowning in data to actually knowing whether marketing works runs through understanding what a measurement strategy really is (less than you think), seeing why measuring marketing effectiveness is harder than everyone pretends despite having more data than ever, building the metrics hierarchy that connects boardroom questions to campaign data, applying the critical few principle to cut your list to what drives decisions, pairing leading and lagging indicators so you can see problems before they hit the quarterly number, and then walking through how to build a marketing measurement plan that survives contact with real organizations.
What a measurement strategy actually is
A measurement strategy is the layer between your business goals and your analytics tools. It answers four questions, in this order:
- What business outcomes is marketing responsible for?
- Which metrics prove those outcomes are happening?
- Which leading indicators predict those outcomes before they arrive?
- What will we actually do differently when a metric moves?
Question four is where most metrics frameworks collapse, because teams invest weeks building dashboards, sourcing data, and reconciling numbers across systems without ever defining what changes when a number moves. A KPI framework without action thresholds is a screensaver with more anxiety.
Here's a test you can run right now: for every metric on your current dashboard, ask "If this number dropped 20% next month, what would we do differently?" If the honest answer is "probably nothing" or "bring it up in the next meeting," that metric doesn't belong on the strategic dashboard, and it might not belong anywhere at all. Keeping it visible burns attention that should go to the metrics where a 20% swing actually triggers a real decision.
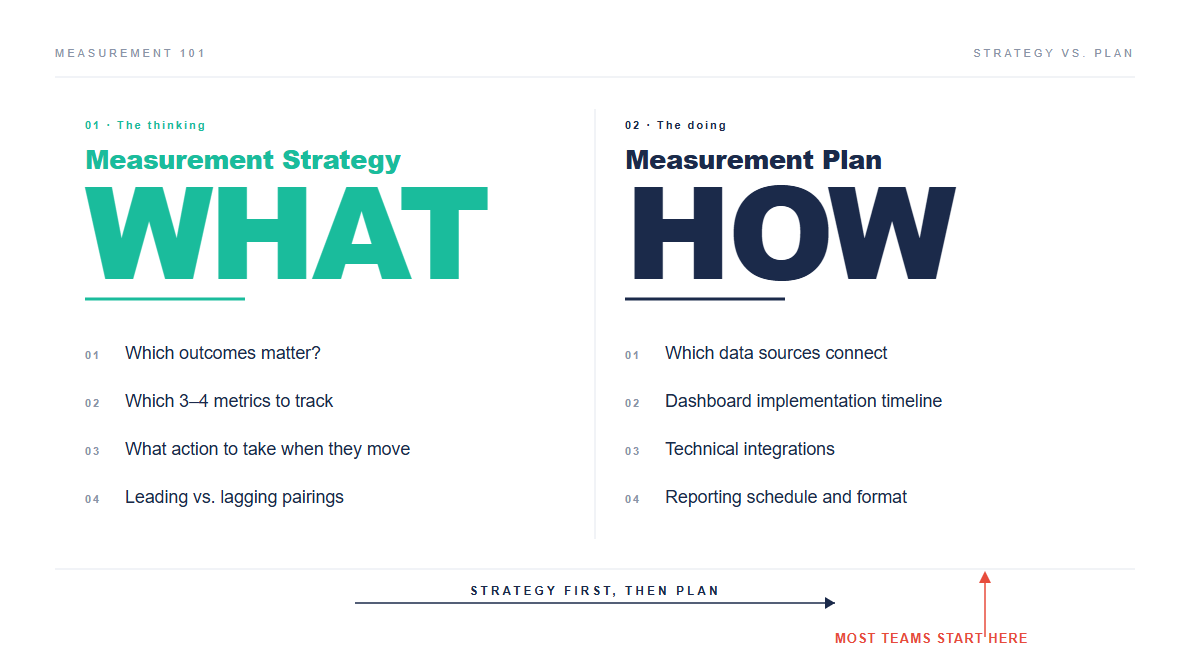
One more distinction that saves confusion later: a measurement strategy is not a marketing measurement plan in the project-management sense (who builds the dashboard, which data sources connect where, what's the implementation timeline). The plan is useful but downstream, because the strategy decides WHAT to measure while the plan decides HOW to operationalize it. Most teams skip straight to the plan without doing the strategy work, which is how you end up with a perfectly functional dashboard that nobody acts on.
Why measuring marketing effectiveness is harder than everyone pretends
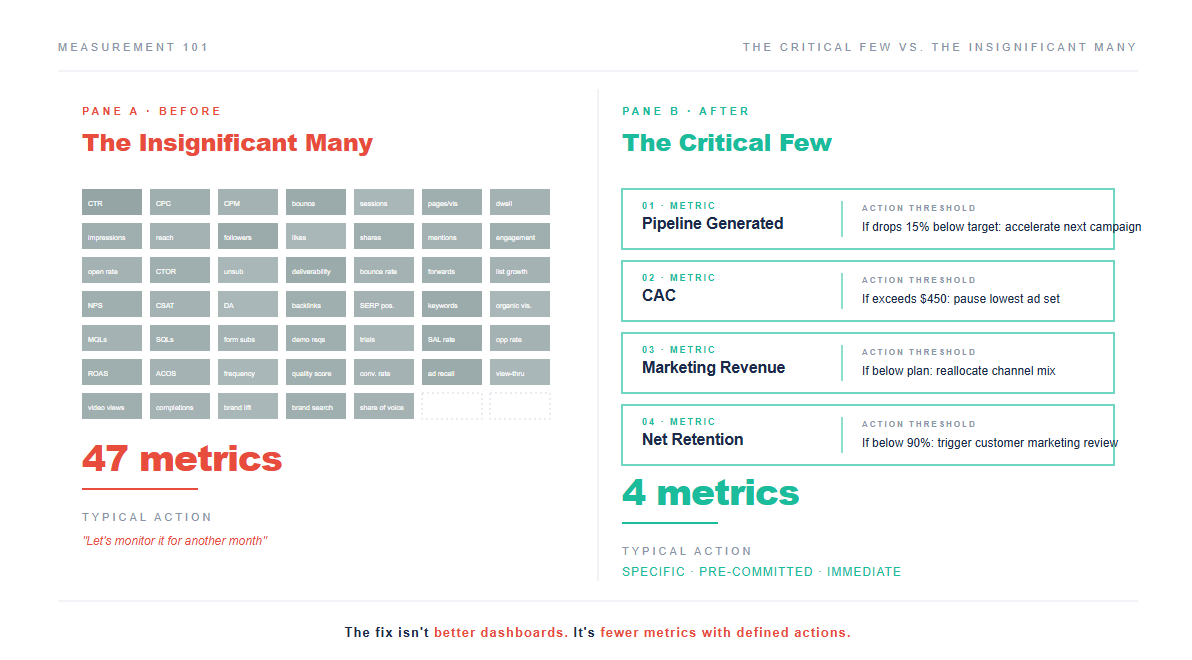
The instinct is reasonable: you're spending $2 million a year on marketing, someone's going to ask where it went, so you measure everything you can: impressions, clicks, Click-Through Rate (CTR), Cost Per Click (CPC), Cost Per Mille (CPM), conversions, conversion rate, MQLs, Sales Qualified Leads (SQLs), pipeline, close rate, revenue, Customer Acquisition Cost (CAC), Customer Lifetime Value (CLV), Return on Ad Spend (ROAS), email opens, email clicks, unsubscribes, page views, sessions, bounce rate, time on site, social followers, social engagement, share of voice, domain authority, backlinks, keyword rankings, Net Promoter Score (NPS)...
Forty-seven metrics later, you have a dashboard that takes 15 minutes to load and proves nothing.
The problem isn't the individual metrics, because each one in isolation is defensible. The problem is that tracking everything creates the illusion of insight without the discipline of prioritization, and when everything is measured equally the important signal drowns in the noise of the merely interesting.
There's also a subtler trap: when you have 47 metrics, teams cherry-pick whichever numbers look good that month. If paid media had a rough quarter, someone leads with the organic traffic chart; if content took a hit, someone pivots to the email engagement slide. The dashboard becomes a buffet of rationalizations rather than a measurement strategy, where nobody lies exactly but nobody gets confronted with the numbers that would force a difficult conversation either.
And honestly, this isn't laziness so much as rational behavior, because when leadership reviews dozens of metrics at once nobody can tell which ones actually matter. So individual contributors optimize for the metric that makes their channel look best, which may or may not correlate with what the business needs. The metrics framework itself is creating the misalignment.
There's a concept from process improvement (borrowed from Six Sigma) that cuts through this: the "critical few" versus the "insignificant many." The principle is blunt enough to be uncomfortable: if you have more than four top-level metrics, you haven't done your job well enough and need to go back and cut harder.
Four metrics, not fourteen, and certainly not forty-seven. One company went even further, down to a single metric for the entire business, and the results tell you everything about why radical reduction works (more on that shortly).
But first, the structural question: how do you even decide which metrics are candidates for those four slots?
The metrics hierarchy: from boardroom to campaign
The reason teams end up with 47 metrics isn't a failure of willpower but a failure of structure, because different people in the organization need different levels of detail. The CEO needs to know whether marketing is contributing to revenue growth. The paid search specialist needs to know whether today's CPCs are trending in the right direction. Both questions are legitimate, and the mistake is putting both answers on the same dashboard at the same level of visibility.
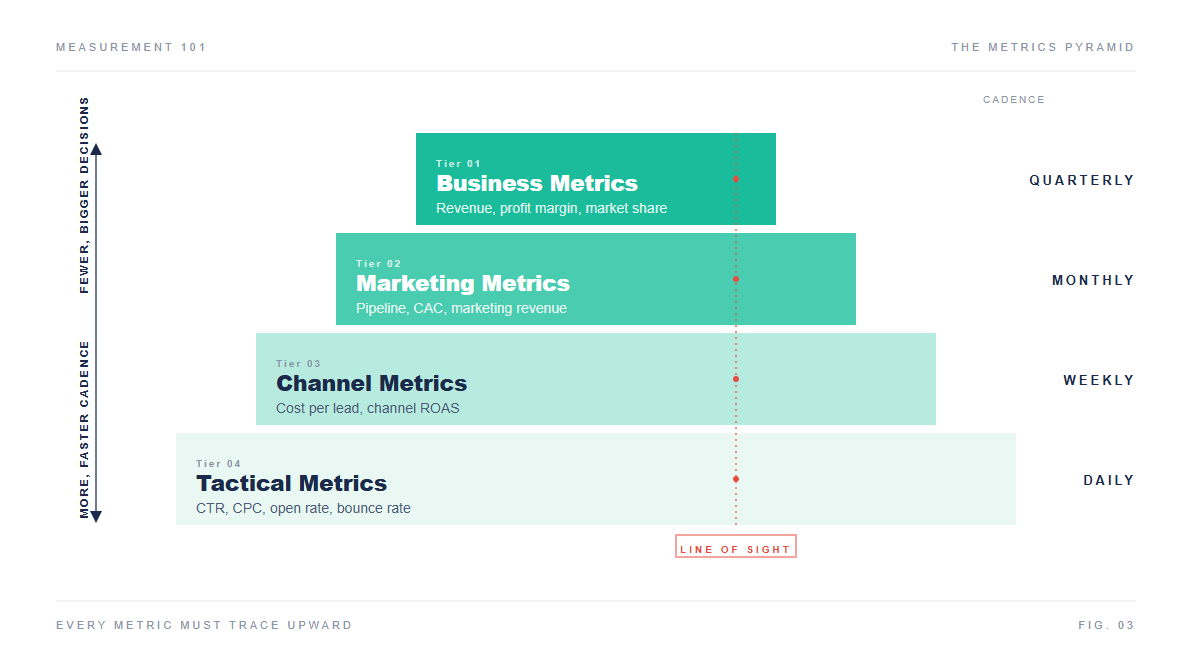
A measurement strategy organizes metrics into four levels, each serving a different audience and decision:
| Level | What it answers | Who uses it | Example metrics | Cadence |
|---|---|---|---|---|
| Business metrics | Is the company healthy? | CEO, CFO, Board | Revenue, profit margin, market share, customer count | Quarterly |
| Marketing metrics | Is marketing contributing? | CMO, VP Marketing | Pipeline generated, CAC, marketing-sourced revenue, marketing ROI | Monthly |
| Channel metrics | Which channels are working? | Channel leads, managers | Cost per lead by channel, channel conversion rates, channel ROAS | Weekly |
| Tactical metrics | Are campaigns executing well? | Specialists, analysts | CTR, CPC, email open rate, page views, bounce rate | Daily |
Think of it the way a company's reporting structure works. The CEO doesn't read every Slack message in every channel; they read a briefing that summarizes what matters. Department heads see more granularity. Individual contributors work in the raw detail. The metrics hierarchy does the same thing: each level filters signal from noise so the right person sees the right information at the right altitude.
The hierarchy principle is simple: every metric at a lower level must trace upward to a metric at the level above it. If your email click-through rate can't be connected, through a clear chain, to pipeline generated, it shouldn't be on the marketing leadership dashboard; it might belong on the email specialist's operational screen, but it hasn't earned a seat at the strategic table.
The line of sight test
Call it the "line of sight" test: can the person tracking a metric explain, in one sentence, how improving it moves a metric at the level above? If the answer is yes, the metric belongs in the hierarchy, but if the explanation requires three paragraphs and two caveats, the connection is too weak to justify its presence.
Here's what this looks like in practice: say you run marketing for a B2B Software as a Service (SaaS) company. Your top-level business metric is Annual Recurring Revenue (ARR) growth. The marketing metric that feeds it is pipeline generated (new qualified pipeline is the precursor to new revenue). The channel metric is cost per qualified lead by channel (tells you which channels efficiently create that pipeline). The tactical metric for paid search is cost per click on high-intent keywords.
CPC on high-intent keywords feeds cost per qualified lead, which feeds pipeline generated, which feeds ARR, forming one unbroken chain across all four levels. The paid search specialist knows that reducing CPC on the right keywords pushes cost per lead down, which means more pipeline per dollar, which means more ARR. That line of sight creates motivation and focus that a 47-metric dashboard never will.
One metric: the Blinds.com case
The most extreme version of this hierarchy I've encountered is a case study from an ecommerce company, Blinds.com. Their CMO managed to distill the entire company's measurement focus to a single metric for the entire organization: Gross Margin per Visitor.
The result was remarkable, because every decision, whether about marketing spend, product pricing, hiring, or customer support, answered one question: "How does this improve our Gross Margin per Visitor?" Supporting metrics still existed (repeat/referral rate, percentage of sales completed via self-service, sample-to-order conversion rate). But each supporting metric had a direct line of sight to the one that mattered. If a supporting metric couldn't draw that line, it got cut.
Over two years, the number steadily improved. The entire organization finally knew which direction "up" was, and every supporting metric, every team priority, every budget decision aligned toward that same outcome.
Most companies won't get to one metric, but the distance between one and forty-seven tells you exactly how much room there is to cut.
The critical few principle
If the hierarchy gives you structure (which metrics exist at which level), the critical few principle gives you the knife.
Think of it like a cockpit instrument scan. A commercial aircraft cockpit has dozens of gauges, but pilots are trained on six primary instruments for routine flight: attitude, airspeed, altitude, turn coordinator, heading, vertical speed. Everything else is there for specific situations, not constant monitoring. Your critical few metrics are the marketing equivalent of those primary flight instruments: the gauges you check on every pass, the ones that tell you whether you're flying level or drifting toward the ground.
Here's the exercise: gather whoever makes decisions about marketing budget in a room (usually CMO, VP Marketing, and 2-3 senior channel leads) and ask these six questions, writing the answers on a whiteboard rather than a spreadsheet because the conversation matters more than the documentation.
- What is the most important thing marketing is solving for right now?
- If one number could tell you the business is going up in flames, which one would it be?
- Which metrics prove the three priorities you're executing against are having an impact?
- Have you separated the "nice to know" from the "have to know"?
- If you had $100 to divide among all marketing activities, how would the money split? Who gets the most?
- What's the biggest competitive threat, and how would you know if it's already hurting you?
The answers will be dominated by outcomes: revenue, pipeline, customer acquisition cost, retention. If you don't end up with specific outcomes, the answers aren't honest yet, so push harder. When someone says "brand awareness," ask: "Awareness measured how? What outcome does it produce? If awareness went up 30% and revenue stayed flat, would you call that a win?"
Almost always, this exercise cuts the list from dozens to under ten. The final step is the hard one: from those ten, pick four. The four that, if they all moved in the right direction simultaneously, would mean marketing is unambiguously working. Everything else stays in the hierarchy as supporting detail, tracked by specialists and accessible in operational reports but absent from the Monday leadership review and the CEO's line of sight.
When I've facilitated this exercise with B2B marketing teams, question two is always the turning point. "If one number could tell you the business is going up in flames, which one?" That question cuts through the politics because it's existential, not departmental. Nobody argues for email open rate when you're asking about the fire alarm. I've watched a room full of marketing leaders go from defending 47 metrics to agreeing on four in under an hour. The difficulty isn't the framework itself but the organizational politics of admitting that 43 of your 47 metrics don't matter enough to review weekly. People built those dashboards and own those numbers, so telling a channel lead that their favorite vanity metric isn't one of the critical few is a conversation most measurement strategies try to avoid by just including everything.
Don't avoid that conversation, because the conversation itself is the point.
Leading and lagging indicators in marketing
So you've run the exercise and you have your four critical metrics, each with a clear line of sight to business outcomes, but there's a timing problem most teams hit almost immediately: all four of those numbers are probably lagging indicators.
Revenue, conversions, pipeline generated, customer acquisition cost: these numbers tell you what already happened, and they're the financial statements of marketing, essential for accountability but useless for steering. By the time you see a pipeline miss in the monthly report, the campaigns that caused it ran six weeks ago.
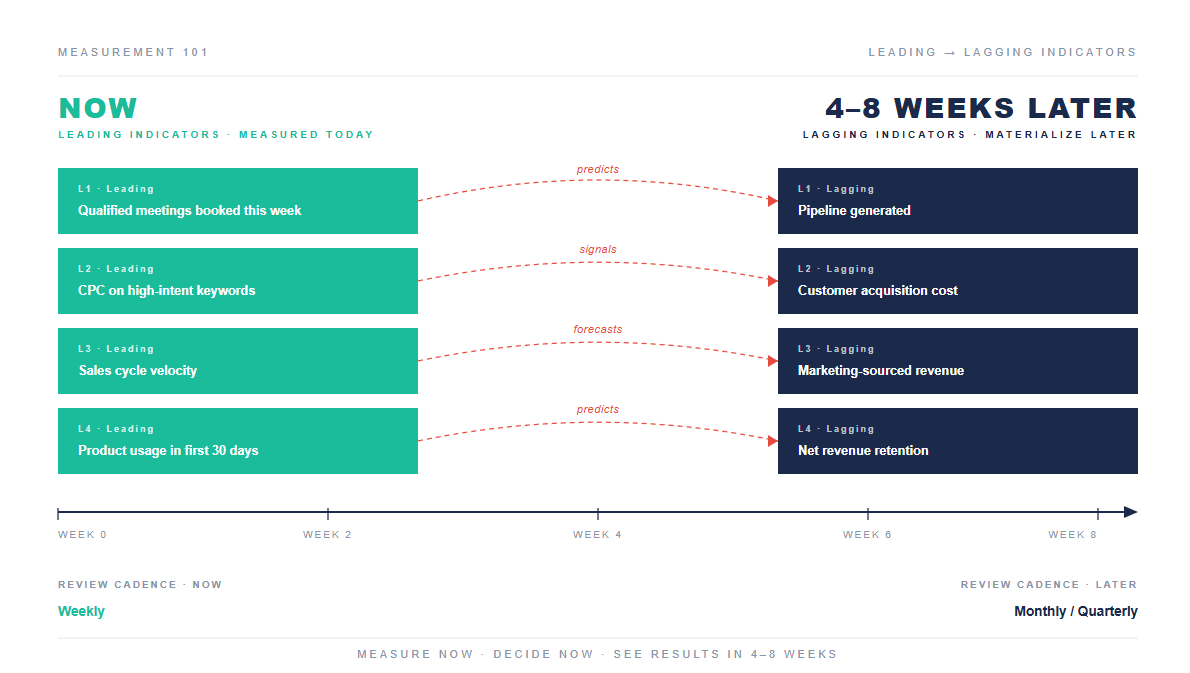
A measurement strategy pairs every lagging indicator with at least one leading indicator: a metric that predicts the outcome before it arrives.
| Lagging indicator (the result) | Leading indicator (the predictor) | Why it predicts |
|---|---|---|
| Pipeline generated | Qualified meetings booked this week | Meetings are the input that produces pipeline 3-4 weeks later |
| Customer acquisition cost | CPC on high-intent keywords | Rising CPC signals that acquisition will get more expensive before it shows in CAC |
| Marketing-sourced revenue | Sales cycle velocity for marketing leads | Slowing velocity means revenue recognition will lag even if lead volume holds |
| Net revenue retention | Product usage in first 30 days | Early usage patterns predict retention better than any satisfaction survey |
Leading indicators let you act before the lagging numbers tell you it's too late. If qualified meetings drop this week, you can adjust campaign spend, fix a broken landing page, or escalate a lead routing issue before it shows up as a pipeline miss three weeks from now.
The reporting cadence should match the indicator type. Review leading indicators weekly (daily for the most volatile ones). Review lagging indicators monthly or quarterly. Mixing them on the same cadence is how teams end up panicking about daily revenue fluctuations (noise) while ignoring weekly leading indicator trends that are screaming about a problem nobody's addressing (signal).
One caveat on leading indicators: they require validation. Just because qualified meetings booked correlates with next-month pipeline in your historical data doesn't mean it always will. Validate the relationship quarterly, because if the leading indicator stops predicting the lagging one you need to replace it with something that does. A leading indicator that doesn't actually lead is just another vanity metric with a fancier name.
How to build a marketing measurement plan
Here's the practical version, and it works for a 5-person startup marketing team or a 50-person enterprise org because the framework scales while only the specific metrics change.
Step 1: Start with business outcomes, not marketing activities
Ask "What does the business need from marketing in the next 12 months?" rather than "What is marketing doing?" because the distinction between activities (things you do, like running ads, publishing content, or hosting webinars) and outcomes (things you produce, like pipeline, revenue, or customer acquisition) determines what your measurement strategy should track versus what belongs in your operating plan.
Common business outcomes for B2B marketing include pipeline generation, customer acquisition, revenue contribution, market share growth, and retention and expansion (if marketing owns customer marketing), and you should pick no more than three.
Step 2: Build the hierarchy
For each business outcome, work downward through the four levels. What marketing metric feeds this outcome? What channel metrics feed the marketing metric? What tactical metrics feed the channel metrics?
Do this on paper or a whiteboard first, because it takes about 30 minutes and the result is a tree with three branches (one per business outcome), each branching into three or four levels. The total number of metrics in the entire tree should land somewhere between 15 and 25, which is your measurement universe rather than your dashboard.
To build this in a spreadsheet: put business outcomes in column A, marketing metrics in column B, channel metrics in column C, and tactical metrics in column D. Draw arrows or use indentation to show which feeds which. Every cell in column D should trace rightward to a cell in column A without gaps.
Step 3: Apply the critical few
From the full hierarchy, pick four top-level metrics for the strategic dashboard. Use the six questions from the critical few section. Everything else stays in the hierarchy as operational detail, accessible to specialists but absent from the leadership review.
Step 4: Pair leading and lagging
For each of your four critical metrics, identify one leading indicator. That gives you eight numbers total, and that's your entire Monday dashboard: four lagging outcomes that tell you whether marketing is working, and four leading indicators that tell you whether it will be working next month.
Step 5: Define the "so what" for every metric
For each of your eight metrics, write one sentence: "If this metric [moves X% in Y direction], we will [specific action]."
If you can't write that sentence, the metric doesn't drive decisions and should be replaced with one that does.
Examples:
- "If pipeline generated drops 15% below quarterly target, we accelerate the next campaign launch by two weeks and increase paid spend by 20%."
- "If cost per qualified meeting exceeds $450, we pause the lowest-performing ad set and reallocate budget to the top two."
- "If qualified meetings booked drops below 12 per week for two consecutive weeks, the demand gen lead escalates to VP Marketing within 48 hours."
These aren't elaborate decision trees but pre-committed responses, and their value is that they prevent the "let's monitor it for another month" default, which is how teams watch slow-moving problems become quarterly crises.
Step 6: Set the reporting cadence
| What gets reviewed | Cadence | Format | Duration |
|---|---|---|---|
| Leading indicators (4 metrics) | Weekly | Slack update or 5-minute standup | 5 min |
| Critical few + leading (8 metrics) | Monthly | Marketing leadership review | 30 min |
| Full hierarchy (all levels) | Quarterly | Deep-dive with analysts + channel leads | 60-90 min |
| Business metrics | Quarterly | Board or exec presentation | 15 min |
The weekly check on leading indicators is the single highest-leverage meeting in marketing. It takes five minutes, covers four numbers, and asks one question: is anything off track, and if so, who owns the response? That replaces the 45-minute dashboard review where everyone recites numbers and nobody decides anything.
What most measurement strategies miss
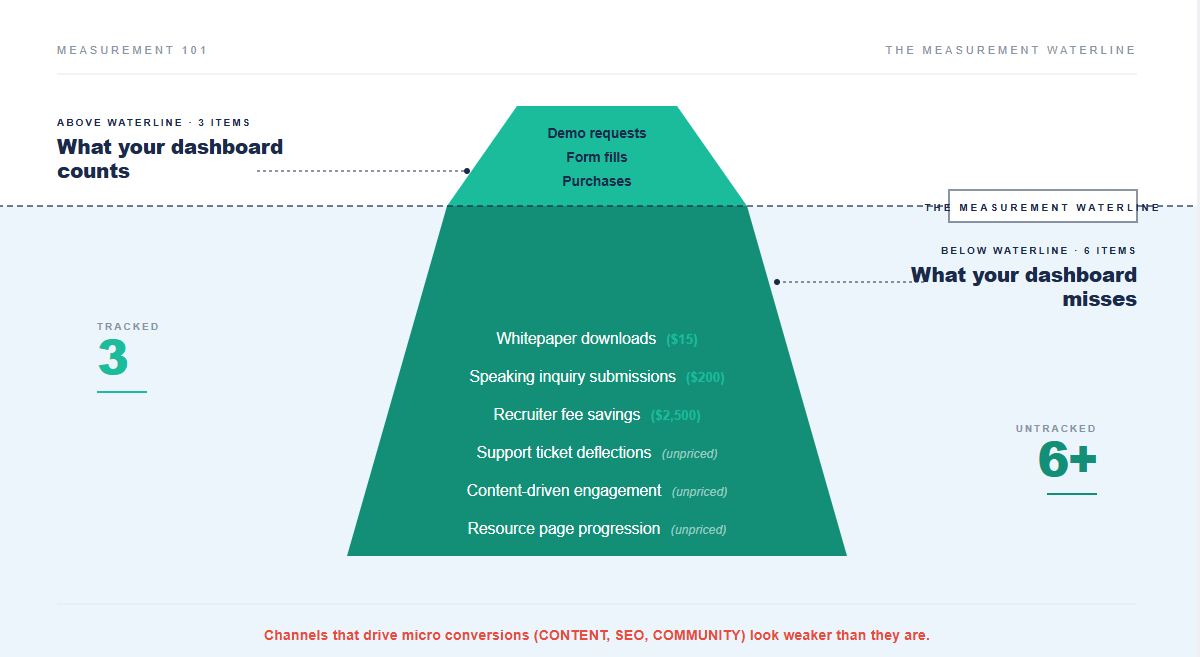
If you've followed the framework through all six steps (hierarchy, critical few, leading/lagging pairs, action thresholds, cadence), you have a measurement strategy that's stronger than most of what's out there. But there's one more dimension that quietly undermines even well-structured measurement, and it's particularly costly for B2B companies or anyone whose website doesn't directly sell products.
Most teams only assign economic value to direct conversions: a form fill, a demo request, a purchase. Everything else (the blog post that builds awareness, the resource page that moves a prospect from "curious" to "engaged," the customer support content that deflects a ticket) gets tracked in activity metrics like page views and time on site. Those metrics never connect to dollars.
This is a bigger blind spot than it sounds. A web analytics framework for computing economic value suggests assigning dollar proxies to every meaningful action on your site, not just the obvious conversions. A whitepaper download might be worth $15 (what you'd pay for a qualified name on a purchased mailing list). A speaking inquiry form submission might be worth $200 (average conference revenue divided by typical inquiry-to-booking rate). An online job application that leads to a hire might save $2,500 in recruiter fees.
When you roll all of these micro conversions up alongside your macro conversions (the demo requests, the purchases), the total economic value is often dramatically larger than what your dashboard currently shows. Most companies only measure the obvious conversions and leave the rest uncounted.
For your measurement strategy, this means your "marketing-sourced revenue" metric might be dramatically understating what marketing actually produces. The channels that drive those undervalued micro conversions (usually content, SEO, community) look worse in the reports than they deserve, which leads to underfunding the very programs quietly building the most long-term value.
This connects directly to the attribution problem we examined in our multi-touch attribution analysis: upper-funnel channels consistently look weaker because the measurement framework doesn't count most of what they produce. Fix the measurement strategy and the budget conversation changes.
What changes when measurement actually works
Building a measurement strategy doesn't produce better numbers; it produces better questions. Instead of "what happened last month?" you get "why is our leading indicator for pipeline trending down this week, and what are we going to do about it before it hits the quarterly number?"
Instead of a 45-minute dashboard review where everyone talks and nobody decides, you get an 8-minute check on four numbers and a 15-minute conversation about the one that moved.
Instead of the CEO asking "is marketing working?" and getting a hedge, you get: "Pipeline is on target, CAC is 12% above plan because paid costs spiked in Q3, here's the specific adjustment we're making this week, and here's the leading indicator we're watching to confirm it's working."
The team with a measurement strategy doesn't have more data than the team with 47 metrics; they have less, but they know what the data means and, more importantly, what they'll do about it.
That's the difference between measurement and measurement strategy: one counts things, and the other changes decisions.
Further reading
- Multi-Touch Attribution vs. Last-Click: why the attribution model feeding your metrics might be giving credit to the wrong channels
- How to Calculate Marketing ROI (MROI): the specific formula for connecting campaign spend to lifetime customer value, and why first-deal ROI systematically misleads
- Customer Journey Attribution: mapping every touchpoint to revenue, and where most journey maps fall short
- Lead Attribution: connecting pipeline metrics back to the specific marketing activities that generated them
- Unified Marketing Measurement: combining MTA, marketing mix modeling, and incrementality into a single measurement framework
Frequently asked questions
What is a marketing measurement strategy?
A marketing measurement strategy is the decision framework that determines which metrics a marketing team tracks, how those metrics connect to business outcomes, and what actions the team takes when metrics move. It sits between business goals and analytics tools. A strong measurement strategy centers on 3-4 critical metrics organized in a hierarchy (business metrics at the top, tactical metrics at the bottom), each paired with a leading indicator and a pre-defined action threshold. The goal is decisions, not data.
What marketing measurement tools do I need?
The tools matter far less than the framework. Most B2B teams can build an effective measurement strategy using a Customer Relationship Management (CRM) system (Salesforce, HubSpot), a web analytics tool (GA4), and a spreadsheet for the hierarchy and critical few exercise. The value comes from choosing the right metrics and the right cadence, not from buying a platform. That said, as measurement matures, tools for unified marketing measurement (combining attribution data, marketing mix modeling, and incrementality testing) become valuable for companies spending $1M+ annually on marketing. Start with the framework and only buy tools when the framework outgrows the spreadsheet.
How is a measurement strategy different from a marketing measurement plan?
A measurement strategy defines WHAT to measure and WHY: which metrics matter, how they connect to business outcomes, and what actions they trigger. A marketing measurement plan defines HOW and WHEN: the implementation timeline, data sources, technical integrations, and reporting schedule. Strategy first, plan second. Most teams skip straight to the plan (building dashboards, connecting data sources, choosing tools) without doing the strategy work (deciding which 3-4 metrics actually drive decisions). The result is an expensive, fully functional dashboard that nobody acts on.
How many KPIs should a marketing team track?
The critical few principle, adapted from Six Sigma for marketing analytics, recommends no more than four top-level strategic metrics on the leadership dashboard. Supporting metrics exist beneath them in the hierarchy, tracked by the channel specialists who need them. But the Monday review should cover four critical metrics plus four paired leading indicators, which gives you eight total numbers. If you're reviewing more than that weekly, you're diluting attention without improving decisions. The Blinds.com case (one company that distilled its measurement to a single metric, Gross Margin per Visitor, and saw steady improvement over two years) is extreme, but the direction is right: fewer metrics, clearer line of sight to outcomes.
What's the difference between leading and lagging indicators in marketing?
Lagging indicators measure outcomes that already happened: revenue, pipeline generated, conversions, customer acquisition cost. They're essential for accountability but useless for steering, because by the time the number appears, the opportunity to influence it has passed. Leading indicators predict those outcomes before they arrive: qualified meetings booked this week predicts next month's pipeline; rising CPC on high-intent keywords signals that CAC will increase before it shows up in the quarterly report. A good measurement strategy pairs each lagging indicator with at least one leading indicator and reviews them on different cadences: leading indicators weekly (to catch problems early), lagging indicators monthly (to confirm trajectory).