MROI Explained: Why Most Teams Calculate Marketing ROI Wrong

Every B2B marketing team knows how to calculate MROI. Revenue minus cost, divided by cost, multiply by 100. Simple enough to fit on a slide and survive a CFO meeting.
And it's quietly destroying your best campaigns while making your weakest ones look like stars.
The formula itself works fine. The problem is what most teams plug into it. They count profit from a campaign's first closed deal and stop there, valuing every customer at what they contributed once and ignoring everything they'll contribute over the next three, five, ten years.
There's a specific number from budget allocation research that quantifies just how far off this gets. It'll probably change what you argue for in your next quarterly review.
TL;DR: MROI (Marketing Return on Investment) measured on first-deal profit systematically favors channels that close fast and penalizes channels that acquire better, longer-lasting customers. The fix is calculating MROI using customer lifetime value instead of single-transaction profit. When you do, the channel rankings often flip, and so should your budget. To get lifetime value right, you need retention rates split by acquisition channel, because that's the axis your budget decisions actually sit on.
The path from broken marketing measurement to better budget decisions runs through what MROI actually measures (less than you think), the lifetime MROI formula that replaces first-deal math, why your retention rate is probably wrong in two specific ways, why your budget allocation is probably backwards according to published research, the 80% of marketing impact nobody counts, and four practical steps to increase marketing ROI using data you already have.
What MROI actually measures (and what it misses)
MROI stands for Marketing Return on Investment. In revenue operations, it's the report card marketing hands to finance every quarter to justify its budget. The formula you'll see everywhere looks simple enough:
MROI = (Profit from Campaign - Campaign Cost) / Campaign Cost x 100
One word in that equation is doing enormous work, and almost nobody interrogates it: "profit." What counts as profit? Revenue from the first deal only? Or the full profit a customer generates over their entire relationship with you?
That distinction is the difference between measuring campaign performance correctly and measuring it in a way that systematically punishes your best work. Let me show you with a scenario we'll carry through the rest of this article.
The LinkedIn vs Content example
You run two campaigns side by side.
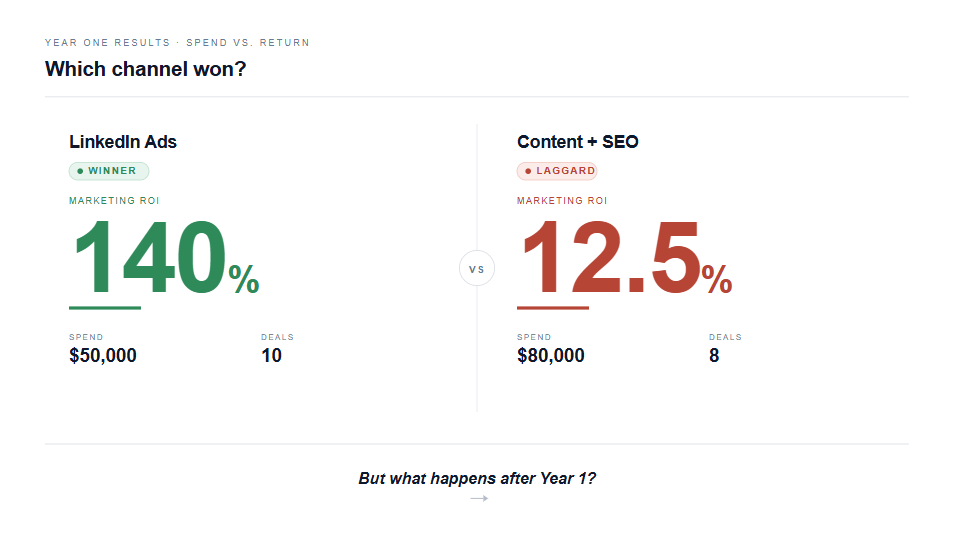
Campaign A (LinkedIn Ads): You spent $50,000 and closed 10 deals, each worth $20,000 annually at 60% gross margin, so you're looking at $12,000 profit per customer in year one and $120,000 total. MROI = ($120,000 - $50,000) / $50,000 = 140%. Your VP of Marketing high-fives someone.
Campaign B (Content + SEO): You spent $80,000 and closed 8 deals at $15,000 annually with 75% gross margin, so $11,250 profit per customer and $90,000 total. MROI = ($90,000 - $80,000) / $80,000 = 12.5%. Your VP of Marketing starts asking if the content team is worth the headcount.
Based on these numbers, the obvious call is to shift budget from content to LinkedIn next quarter, and that's exactly what most teams do.
But here's what those numbers don't show.
What happens after year one
The content customers renew at 90% annually and expand their contracts modestly each year. The LinkedIn leads churn at 30% in the first year and barely expand at all.
We don't know the exact lifetime value yet (we need a formula for that, which is coming next). But the direction is already clear: Campaign B is producing customers who stay much longer. Campaign A is producing customers who leave. And the standard MROI formula can't tell the difference because it stops counting after the first transaction.
Speed gets rewarded while value gets ignored, and the formula looks so reasonable that nobody thinks to question it.
The MROI formula that actually works
The fix is conceptually simple: replace first-deal profit with Customer Lifetime Value (CLV).
Lifetime MROI = (Sum of Customer Lifetime Values - Campaign Cost) / Campaign Cost x 100
Instead of asking "how much profit did this campaign generate this quarter," you're asking "how much total economic value will these customers create over their full relationship with us?" Same data, completely different answers.
How to calculate customer lifetime value
CLV sounds like it requires a complex forecasting model. It doesn't.
Think of it like valuing a rental property. You wouldn't buy a building based on one month's rent. You'd estimate the full rental income over the years you expect to own it, discounted for the risk that tenants move out. CLV does the same thing for customers: it takes the annual profit they generate and extends it across their expected lifetime, accounting for the probability they'll leave each year.
The core formula needs just three numbers: your annual profit per customer, a retention rate, and a discount rate (the time value of money, typically 10-15%, reflecting that a dollar next year is worth slightly less than a dollar today because you could invest today's dollar and earn a return on it):
CLV = Annual Profit per Customer x Multiplier
Where:
Multiplier = (1 + discount_rate) / (1 + discount_rate - retention_rate)
Quick note on "annual profit": this is revenue minus your cost to serve that customer. If the contract is $20,000 and your gross margin is 60%, the annual profit input is $12,000.
Always use profit, not revenue. Using revenue will overestimate CLV by however wide your margins are, and every MROI comparison downstream inherits the error. The payback period on your marketing investment becomes much clearer once you can see the full value trajectory rather than just the first deal.
Why retention makes the multiplier explode
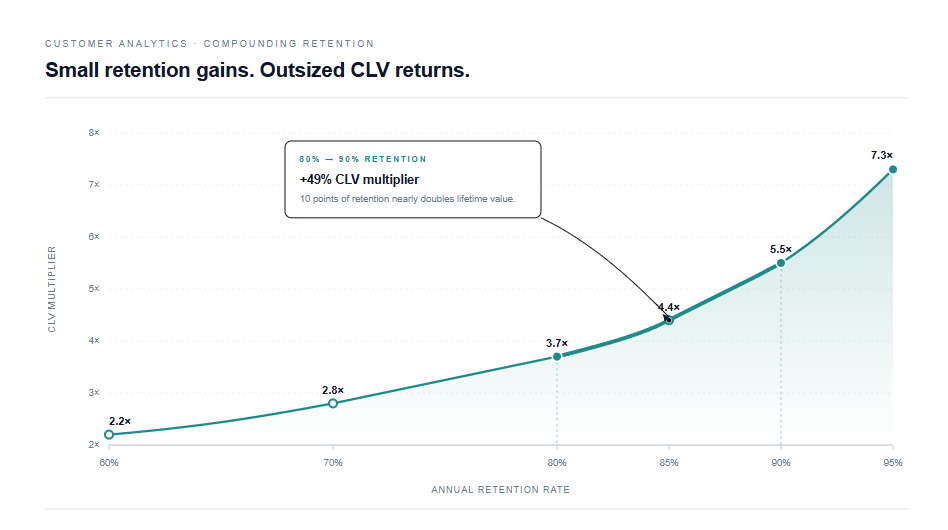
Here's where this gets genuinely surprising. At a 10% discount rate:
| Annual Retention | Multiplier | What it means |
|---|---|---|
| 60% | 2.2x | Customer worth about 2 years of profit |
| 70% | 2.8x | |
| 80% | 3.7x | |
| 85% | 4.4x | |
| 90% | 5.5x | |
| 95% | 7.3x | Customer worth over 7 years of profit |
To build this yourself in Excel or Google Sheets: put retention rates in column A (60%, 70%, etc.) and enter =(1.1)/(1.1-A2) in column B. One formula. Drag it down and watch the multiplier accelerate. You can swap the 1.1 for (1 + your own discount rate) if your cost of capital differs.
The multiplier behaves like compound interest, but in reverse. Each percentage point of retention you gain is worth more than the last one, because the customer who stays another year stays into a future where they keep staying.
Jumping from 80% to 90% retention doesn't add 10% more value. It adds close to 50% (from 3.7x to 5.5x). Going from 90% to 95% adds another 33%.
This is the part most people miss.
What this means for our two campaigns
Now let's revisit the LinkedIn vs Content example with the multiplier.
LinkedIn customers retain at 70%. Multiplier = 2.8x. Annual profit = $12,000.
CLV = $12,000 x 2.8 = $33,600 per customer
Content customers retain at 90%. Multiplier = 5.5x. Annual profit = $11,250.
CLV = $11,250 x 5.5 = $61,875 per customer
The content customers are worth almost twice as much over their lifetime, despite generating less profit in year one. Now run the lifetime MROI:
LinkedIn Lifetime MROI: (10 x $33,600 - $50,000) / $50,000 = 572%
Content Lifetime MROI: (8 x $61,875 - $80,000) / $80,000 = 519%
The gap between the two campaigns just narrowed from 140% vs 12.5% to 572% vs 519%. Content went from looking like a rounding error to being competitive with your top channel. And if content's retention were even slightly higher (say 92% instead of 90%), its return on investment would overtake LinkedIn entirely.
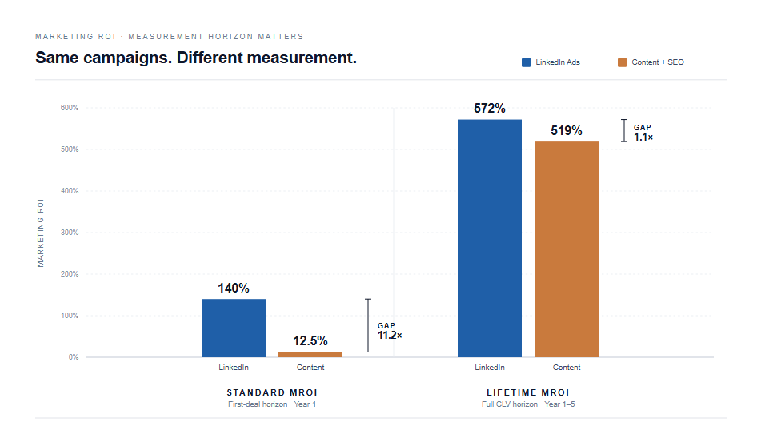
That's the marketing ROI improvement you get from connecting MROI to lifetime value. The rankings shift because the formula finally accounts for what happens after the first deal. For SaaS companies and other subscription businesses, where the entire revenue model depends on retention, this distinction is especially stark.
Your retention rate is probably wrong (and here's how to fix it)
The lifetime MROI calculation is only as good as the retention rate you plug into it. And most companies get this number wrong in two specific ways.
The aggregate retention trap
Most companies report a single retention number. "We retain 88% annually." Sounds precise. But that number is a weighted average of all your customer cohorts, and the weighting depends on your acquisition mix.
Say you acquired an unusually large batch of customers through your referral program last year. Referral customers tend to retain well in their early months. Your aggregate retention ticks up to 90%.
Leadership celebrates the improvement, but if you tracked each year's cohort separately, you might find that the 2023 cohort retained at 87%, the 2024 cohort at 85%, and the 2025 cohort at 83%.
The underlying trend is declining. You just can't see it because fresh, high-retention customers are pulling the average up.
And here's where it matters for MROI: the difference between 85% and 90% retention is the difference between a 4.4x and 5.5x multiplier. That's a 25% swing in every CLV you calculate. If your retention number is inflated by acquisition mix effects, every lifetime value comparison downstream is built on sand.
Watch out for the churn compounding trap
One related mistake that makes this worse: if your monthly churn is 5%, your annual churn is not 60%, it's 46%.
Churn compounds, and the math catches most teams off guard: (1 - 0.05)^12 = 0.54, meaning only 54% of customers survive the full year. Getting this conversion wrong throws off your multiplier by roughly 25%. It's one of the most common mistakes in SaaS churn reporting, and it usually overstates retention (because teams multiply monthly churn by 12, get a scarier number, and then "correct" it downward using intuition instead of the formula).
Why channel-level retention matters more than time-based cohorts
Year-based cohorts tell you whether retention is improving or declining over time. That's useful for the board deck. But for MROI, there's a more important split: by acquisition channel.
Stay with me here, because this is where the analysis gets genuinely actionable. Your MROI calculation compares channels against each other. "Is content marketing generating more value than paid search?" To answer that honestly, you need to know not just how customers retain overall, but how content-acquired customers retain versus paid-search-acquired customers.
When you split retention by channel, you typically find spreads like this:
| Channel | Typical Annual Retention | Multiplier (10% discount) |
|---|---|---|
| Organic / referral | 88-93% | 5.0-6.5x |
| Content / SEO | 85-91% | 4.4-5.8x |
| Events / webinars | 83-88% | 4.0-5.0x |
| Paid search | 70-80% | 2.8-3.7x |
| Paid social | 65-75% | 2.4-3.1x |
Those multiplier differences are massive. A customer acquired through content with a 5x multiplier is worth nearly double a customer acquired through paid social with a 2.8x multiplier, even if they signed the exact same contract on day one. Standard MROI can't see this because it never looks past the first deal. Channel-specific lifetime MROI makes it visible.
This is the data that makes the LinkedIn vs Content comparison above real. Without per-channel retention rates, you're guessing. With them, you know.
Why your budget allocation is probably backwards
So far we've been talking about measuring acquisition campaigns more accurately. But there's a bigger implication hiding in the math, and this is the number I mentioned at the top of the article.
A study published in Harvard Business Review modeled the optimal budget allocation between acquiring new customers and retaining existing ones. Both follow diminishing returns curves: spending more helps, but each additional dollar produces less improvement. When you optimize across both simultaneously, accounting for lifetime value, the result is striking: optimal retention spending is roughly 5x acquisition spending.
Most B2B companies have this ratio inverted. They pour their marketing spend into demand generation and underfund the programs that keep customers.
Why? Partly because the standard MROI formula reinforces it. Return on investment only appears in campaign reports, and campaign reports only cover acquisition. Retention spending is buried in Customer Success (CS) headcount, onboarding costs, and customer marketing budgets that nobody calculates ROI on. It's invisible to the framework, so it's invisible to the budget allocation conversation.
But the CLV math makes it clear. Each retention dollar produces incremental revenue from a smaller, higher-value population (people who already chose you) while each acquisition dollar works on a vast pool of strangers. The diminishing returns on acquisition spending kick in much faster than most teams realize. The study found specifically that for a business with 500 existing customers and a 10,000-person market, the optimal split was about $15 per customer on retention versus $3 per prospect on acquisition.
If you're only measuring the ROI of acquisition campaigns, you're optimizing half the equation. And based on the research, it's the less valuable half. If you want to improve marketing ROI at the portfolio level, retention spending is the highest-leverage budget lever most teams aren't even measuring.
The 80% of marketing impact you're not counting
There's one more dimension the standard MROI formula misses, and this is the thread that ties the whole article together.
Everything we've covered so far is about which profit to count (lifetime vs single-period) and how to calculate it (per-channel retention, not company average). But there's also the question of when you measure.
Marketing research has consistently found that roughly 80-85% of a campaign's total impact doesn't materialize in the quarter you spend the money, a phenomenon known as the adstock effect. It carries forward, building awareness and influencing behavior over months. Only about 15-20% of the total effect shows up in the same period as the spend.
Think about what that means for our LinkedIn vs Content example. LinkedIn Ads produce clicks and conversions in the same quarter. Content marketing produces awareness, trust, and organic discovery over months. If you measure both in Q1 only, LinkedIn captures most of its impact while content captures maybe a fifth.
This is the same revenue attribution bias we see in multi-touch attribution: lower-funnel channels get credit because they're visible at the moment of conversion, while upper-funnel demand generation channels do the awareness-building work that made the conversion possible.
The three biases, combined
Here's where all three threads converge. Upper-funnel channels like content, brand, and events are penalized three ways simultaneously:
- Their customers are measured on first-deal profit only (ignoring higher lifetime value from better retention)
- Their retention advantage is invisible (because most teams use a company-wide retention rate instead of per-channel rates)
- Their lagged impact isn't counted (because the measurement window is too short to capture 80%+ of the effect)
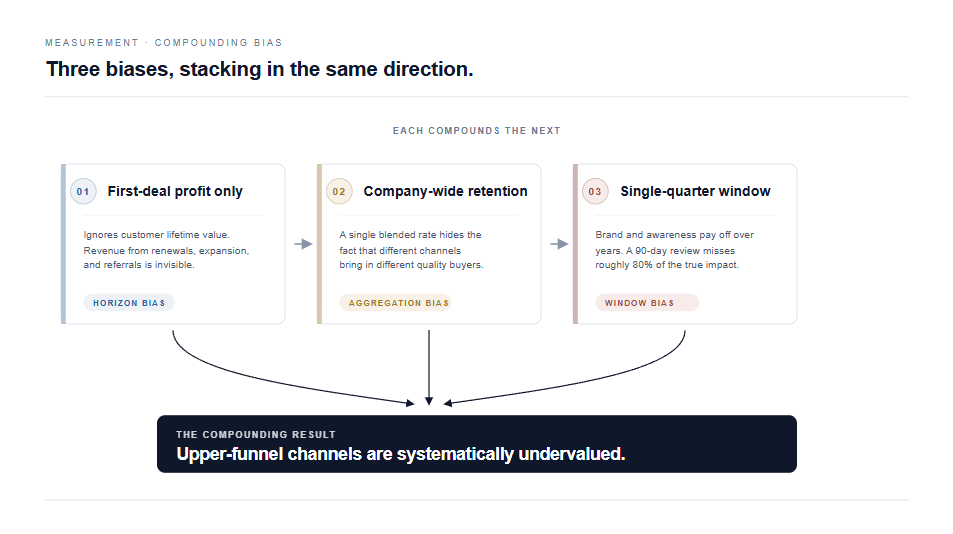
Any one of these biases distorts budget decisions. Together, they create a systematic pattern where the channels building the most long-term value consistently look worst in the quarterly report. Fix all three and the picture of your marketing effectiveness changes dramatically.
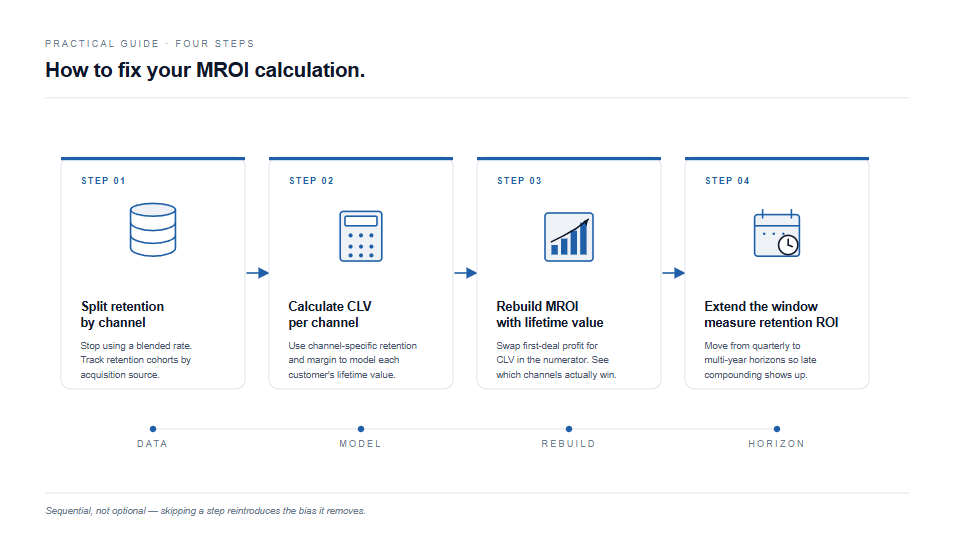
How to increase marketing ROI: 4 practical steps
Here's how to put this into practice. Most B2B advertising ROI calculation methods rely on the same flawed single-period inputs. You don't need new tools or a new marketing analytics platform. You need a different way of pulling and connecting data you already have.
Step 1: Split retention by acquisition channel
Go into your Customer Relationship Management (CRM) system and group closed-won customers by their original acquisition source. Track each group's retention rate over at least 12 months (24 is better).
If you're in Salesforce, this means pulling Campaign or Lead Source data on your Accounts, joining it to renewal or churn records, and calculating survival rates per source.
When I've run this analysis on Salesforce data, the usual surprise is how dramatic the retention spread is by source. In one case, organic leads retained at nearly double the rate of paid social leads, but because the paid campaigns generated bigger first deals, they looked superior on every standard report. The standard MROI was actively arguing for the wrong channel.
It's one afternoon of work, maybe two if your data is messy. And it's the single most revealing analysis most B2B marketing teams have never run.
Step 2: Calculate CLV by channel
Apply the multiplier formula to each channel's retention rate. Use annual profit per customer (contract value times gross margin), not revenue:
Channel CLV = Annual Profit x (1 + discount_rate) / (1 + discount_rate - channel_retention)
Using our running example with a 10% discount rate:
| Channel | Annual Profit | Retention | Multiplier | CLV |
|---|---|---|---|---|
| Content / SEO | $11,250 | 90% | 5.5x | $61,875 |
| Referrals | $13,000 | 89% | 5.2x | $67,600 |
| Events | $12,500 | 85% | 4.4x | $55,000 |
| LinkedIn Ads | $12,000 | 70% | 2.8x | $33,600 |
| Paid Social | $10,500 | 68% | 2.6x | $27,300 |
Notice: the annual profit column varies by channel because different channels attract different customer profiles (different contract sizes, different product mixes, different margins). Pull these numbers from your own CRM by averaging annual profit across customers grouped by acquisition source.
Step 3: Rebuild your MROI with lifetime value
Swap the numbers in your standard report:
Lifetime MROI = ((Customers x Channel CLV) - Campaign Cost) / Campaign Cost x 100
Side by side comparison:
| Channel | Customers | Cost | Standard MROI | CLV | Lifetime MROI |
|---|---|---|---|---|---|
| LinkedIn Ads | 10 | $50K | 140% | $33,600 | 572% |
| Content | 8 | $80K | 12.5% | $61,875 | 519% |
| Events | 6 | $60K | 25% | $55,000 | 450% |
Content went from 12.5% (looks terrible) to 519% (competitive with your top channel), and nothing about the campaigns themselves changed, only the measurement. The campaign your CFO wanted to cut is suddenly defensible, not with feelings or vague appeals to brand awareness, but with the same accounting framework finance already trusts, applied over the correct time horizon.
Step 4: Extend the window and measure retention ROI
Two final adjustments:
For lagged channels, extend your attribution window from one quarter to six or twelve months. A content piece published in January that nudges a deal over the line in September should count toward January's marketing investment.
For retention spending, start measuring return on investment the same way you measure acquisition campaigns. What's the return on your onboarding program? Your customer marketing? Your customer success team's proactive outreach? Remember the research finding: optimal retention spend is 5x acquisition spend. If you're not even measuring retention ROI, you have no idea whether your biggest lever is being pulled.
What changes in your next budget meeting
This is where all of it comes to a head.
When you walk into the next quarterly review with lifetime MROI instead of standard first-deal marketing ROI, the conversation shifts in ways that compound.
The channels that always looked "inefficient" become defensible. Content, brand, community, events. You can show, with numbers, that their customers are worth 2-3x more over their lifetime than performance-channel customers.
The CFO who wanted to cut the content budget is looking at a 519% lifetime MROI instead of a 12.5% first-deal MROI. That's not a philosophical argument about brand building. It's the same accounting framework they already trust, applied over the correct time horizon.
Retention gets its own ROI story, maybe for the first time ever. And honestly, it's probably the strongest number in the room.
Want to improve marketing ROI without spending a single extra dollar on pipeline? Improve retention from 80% to 85%. That bumps the CLV multiplier from 3.7x to 4.4x, an 18% lift in the value of your entire existing customer base.
You don't need new logos or new pipeline, just better retention of the customers you already have. Most acquisition campaigns can't touch an 18% value increase, and a well-funded onboarding program can deliver it for a fraction of the cost.
And the slow bleed stops. The pattern where upper-funnel demand generation gets cut every quarter because lower-funnel "performs better" only continues when the measurement framework is blind to lifetime value, channel-specific retention, and lagged effects. Fix the measurement and the death spiral has no place to hide. The pipeline keeps getting fed at the top because the numbers finally justify feeding it.
The standard MROI formula asks: "which campaign made money this quarter?"
The lifetime version asks: "which campaign built the most valuable customer base?"
Those are different questions. They produce different answers. And the second one is the question your business actually depends on.
Further reading
- Multi-Touch Attribution vs. Last-Click: why the attribution model feeding your MROI might also be misleading you
- Customer Insights and Analytics: The Deal Size Trap: why your biggest deals aren't your best customers (the same first-transaction bias, applied to customer ranking)
- What is Revenue Operations?: the framework connecting marketing, sales, and customer success measurement
- B2B Sales Funnel Analysis: stage-by-stage conversion rate analysis for your pipeline
- Cohort Retention Analysis: how to calculate the per-channel retention rates your CLV depends on
Frequently asked questions
What is MROI and what is marketing investment?
MROI stands for Marketing Return on Investment. Marketing investment includes every cost associated with generating and converting demand: campaign spend, team compensation, technology, content production, and agency fees. The MROI formula measures the profit this marketing investment generates relative to its cost: (Profit - Cost) / Cost x 100. Where most teams get it wrong is in defining "profit" as first-deal only. Using first-deal profit systematically undervalues campaigns that produce customers who renew, expand, and stay for years. Connecting MROI to customer lifetime value gives you a much more accurate picture of which campaigns actually create the most business value.
What is a good marketing ROI?
The typical benchmark is a 5:1 return, with anything above 10:1 considered exceptional. But these numbers are almost meaningless without specifying the time horizon. A 1.1:1 return on first-deal profit could be a 5:1 return when measured against lifetime value, depending on how well those customers retain. The more useful question is whether a campaign's lifetime MROI justifies the marketing investment relative to other things you could spend that budget on.
How do you calculate and measure B2B marketing ROI?
B2B marketing ROI is harder to measure than B2C because sales cycles are longer, revenue attribution is messier, and customer value unfolds across multi-year contracts. The practical approach: pull your CRM data, group closed-won customers by acquisition source, track each group's retention over 12-24 months, calculate a per-channel CLV using the multiplier formula (annual profit times the multiplier, where the multiplier uses your channel-specific retention rate), then plug lifetime value into the MROI formula instead of first-deal profit. In Salesforce, this means grouping Opportunities by Campaign or Lead Source, then joining to renewal data. The key ROI metric to track is lifetime MROI by channel, not single-period campaign performance.
What's the difference between ROI and MROI?
ROI is a general financial metric for any investment. MROI specifically measures marketing investments. The formula is identical but the complexity is different. Marketing costs are harder to isolate (is content team salary a marketing cost?), attribution is ambiguous (which campaign gets credit when a deal has 12 touchpoints?), and returns are often lagged. Research shows 80-85% of marketing impact carries forward into future periods, meaning a single-quarter measurement window captures only a fraction of the real return.
Why does retention rate matter so much for MROI?
Because the CLV multiplier responds exponentially to retention. At a 10% discount rate, moving from 80% to 90% annual retention increases the multiplier from 3.7x to 5.5x, a 49% jump in customer value from a 10-point improvement. That means a campaign acquiring high-retention customers is dramatically more valuable than one acquiring low-retention customers, even when both close the same size first deal. Standard MROI misses this entirely because it never looks past the first transaction.